The phrase "Perfect Storm" is commonly misused to describe various weather patterns and events. It is also said when referring to the movie with Mark Wahlberg and George Clooney, but that is not the issue as those two are very good actors and the movie itself is pretty good. When see a hurricane or a tornado with rain and hail, people will say "Perfect Storm" and use it as saying the storm is massive and horrendous. As the later half may be true, the use of the phrase is not. A "Perfect Storm" as experienced on October 31, 1991 off the coast of the Northern United States, consisted of a warm air from a lower-pressure system meeting cool and dry air from a high-pressure system and then mixing with a tropical moisture. These three occurrences create the "Perfect Storm". The worst-case scenario is nearly synonymous with the phrase but differs in true definition. Below is a link to a picture of the Halloween Nor'Easter. This "Perfect Storm" was true to its definition!
Perfect Storm on October 1991
**Information Courtesy of Wikipedia.org and NOAA.gov
Monday, November 12, 2012
Monday, October 29, 2012
Hurricane ANDREW.
On August 24, 1992 Hurricane Andrew made landfall onto South Florida. The cost was 26.5 billion dollars, the third costliest tropical cyclone in U.S. history. The lowest central pressure was 922 millibars measure approximately 30 minutes after landfall. The storm brought with it 16.9 foot tides. The maximum surface wind speed was believed to be 125 knots, or almost 145 mph, with gusts near 150 knots, or 175 mph. The hurricane was a category 4. The storm was generated off the coast of Africa by a tropical wave on August 14, 1992. After striking Florida, it moved northwest into south-central Louisiana as a category 3 storm. In total, Andrew directly cause 23 deaths and indirectly 38 more in the United States. The number of homes destroyed was 25524 and 101241 were damaged. Hurricane Andrew also produced tornadoes in Louisiana, Alabama, Mississippi and Georgia. The strange thing about Hurricane Andrew was that it weakened and was thought to be dying down before it reached the Bahamas. The Hurricane within a day, greatly intensified and became a class 5 hurricane. Andrew costed 250 million and 4 deaths in the Bahamas.

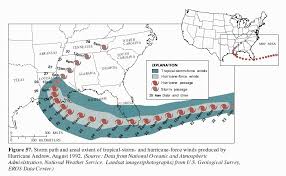
Landfall 5 AM
Hurricane Trajectory
Follow this link for an interactive map Hurricane Andrew
**Information Courtesy of Wikipedia.org and the National Climatic Data Center of the National Oceanic and Atmospheric Administration
**Images Courtesy of Google
Sun Dialing it!
This week in lab we were given the task to record the trajectory of the sun over a day in Macon, Ga. The following pictures are the data collected from the day. This data is from Friday 10/26/2012. The yellow circles on the larger white circle represent the sun at the certain period of the day. You should read the circles from right to left as the sun rises in the East and sets in the West.


**Weather Information Courtesy of Weather.com
Tuesday, October 23, 2012
Wait Grandma!!! (Barometer Glass Jar Lab)
WAIT GRANDMA!!! Grandma almost broke my homemade barometer to can and store some of her garden frown veggies. Sacrificing science for food normally isn't a problem, but this time I have a grade on the line. Now, a homemade barometer is merely as simple as placing a balloon on a glass jar. There are just a few tricks to the trade to make your life easier though. Watch the following video for those SMALL tips.
Nice and correct way
Slightly creepy way
Using the the straw to measure and observe changes, after calibration, will give you a heads up on the weather man/woman for when to grab that rain coat or umbrella!
Below you will see the data collected from our barometer study. The homemade barometer seemed to be relatively accurate once calibrated but didn't give one or two inaccurate points.

Such a Beautiful Rose!
In lab, we discussed the direction and speeds of wind. This is commonly portrayed pictorially by a diagram called a wind rose. The following pictures will be of diagrams of wind speeds and direction in the Augusta, Ga area at Bush Field Airport.


This above picture is the cite where the wind data is collected.


The four diagrams you see above are wind roses courtesy of Lakes Environmental. They all have cardinal directions as well as a color chart used to denote wind speed in Knots. The first and third wind rose are plotted in the direction the wind is blowing from and the second and the fourth are plotted in the direction the wind is blowing to. The first two diagrams are for the day April 25, 1990 while the last two are for the entire month of April during the year 1990.
Sunday, October 21, 2012
Longitudinal Weather and Seasonality
Below you will find different cities approximately on the same line of longitude with their sunrise, sunset and select temperatures. Under the numbers there are also pictures of where the cities lie, shown two at a time for an easier view on the eyes. The purpose of this is to show the relationship of seasonality cities share based on their placement on longitudinal lines. Colombia seems to be in its spring/summer season as the northern hemisphere is in is fall/winter season.
Baltimore, Maryland 3917'N 7637'W
10/21/12
Sunrise 7:23AM
Sunset 6:18PM
High Temp 68
Low Temp 51
Cali, Colombia 325'N 7631'W
10/21/12
Sunrise 5:50AM
Sunset 5:51PM
High Temp 87
Low Temp 65
Virginia Beach, Virginia 3651'N 7559'W
10/21/12
Sunrise 7:18AM
Sunset 6:19PM
High Temp 65
Low Temp 50
Santiago de Cuba, Cuba 2001'N 7548'W
10/21/12
Sunrise 7:00AM
Sunset 6.35PM
High Temp 88
Low Temp 74
Ottawa, Ontario, Canada 4525'N 7541'W
10/21/12
Sunrise 7:28AM
Sunset 6:06PM
High Temp 55
Low Temp 45


*Pictures Courtesy of Google Images
*Weather Information Courtesy of Weather.com
*Latitude and Longitude Data Courtesy of Wikipedia.org
Monday, October 15, 2012
Temperature
Lab
Andrew
Swinford
10/15/2012
Overview: This lab involved taking hourly
temperatures for a given city and recording them. Once data is recorded for an
entire day, the data is summarized in a chart to display the relationship
between temperatures with respect to time of the day.
Equipment: Pencil, Notebook, Computer with internet
access and weather.com
Procedure: Acquire temperature hourly and write down
the temperature in the notebook. The duration should be from morning until
night.
Results: The below table summarizes the data
observed and recorded for Augusta, Georgia on August 25, 2012. The time is
recorded by military standard and the temperature units are Fahrenheit.

Subscribe to:
Posts (Atom)